Key Takeaways
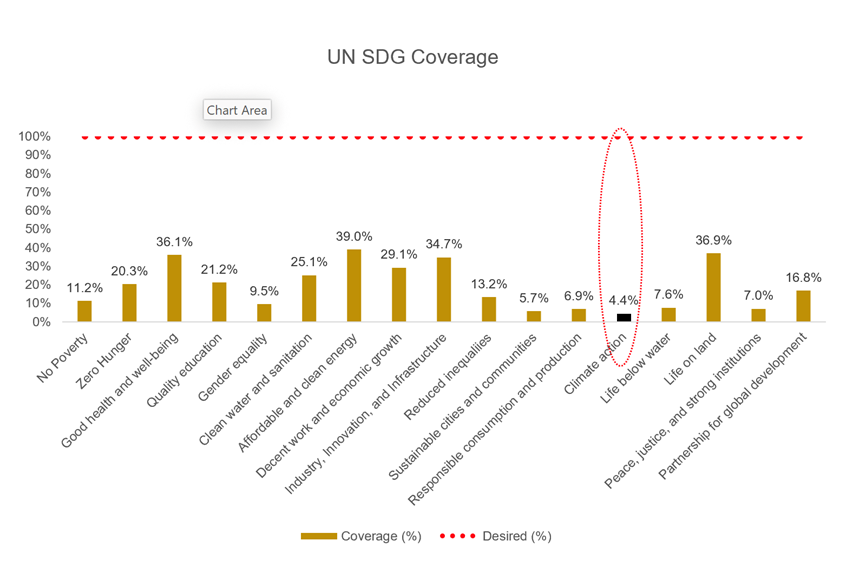
- We lack adequate data to track worldwide performance on the UN’s sustainable development goals (SDGs) e.g. the climate change goals only have 4.4% data coverage.
- Data coverage is worse for lower-income countries that lack “statistical capacity.”
- Pastcasting, ML/AI techniques that “stitch together” noisy and imperfect data to generate higher-quality data useful for research, can help.
- Using India as a case study, we illustrate how to generate and validate a high-quality PM2.5 dataset from lower-quality government and satellite data.
Only 4.4% Data Coverage for the Climate Action Goals
Most of us agree with pursuing the United Nations’ sustainable development goals (SDGs) such as – no poverty, zero hunger, and climate action. Good data is an essential element of making the pursuit effective. Unfortunately, World Bank researchers Dang, Fu, and Serajuddin (2019) report severe sparsity in data coverage. The average data coverage for all sustainable development goals is 19.1%, and for climate action, it is only 4.4%.
Additionally, pursuing climate change related goals can involve managing trade-offs such as socio-economic benefits, competing demands on land, conflict with food security and livelihood, and cultural aspects (Ipcc 2022 report).
A recent paper in Nature finds that countries with low statistical capacity tend to be poorer. Our macro work finds that data quality is worse in three cases – poorer countries, poorer times (recession), and poorer people even in the same countries.
Particulate matter (PM 2.5) – essential in measuring air quality, can be hard to obtain. Poorer countries tend not to have as many on-the-ground monitoring stations and might have to rely on Satellite data that have around 40% missing days to provide relevant measurements.
The Imperfect Inputs
This data is particularly important with atmospheric pollutants such as PM2.5 that the World Health Organization has focused on with their latest guidelines. There have been great efforts to aggregate and collect air quality data sets from different sources, but these have their frictions.
For example, an open-source effort, OpenAQ, has historical data for India that is generally not current—it ends at October 31, 2022. Only five monitoring stations at US diplomatic posts in India have up-to-date, historical data accessible through OpenAQ. According to a UN report, India recently became the most populous country in the world. India’s air quality choices matter. Not only is there friction with accessing up-to-date data, but even when data exists, there can be extensive missing values
Table 1 shows the challenges of accessing PM2.5 data for Lucknow, India from various sources.
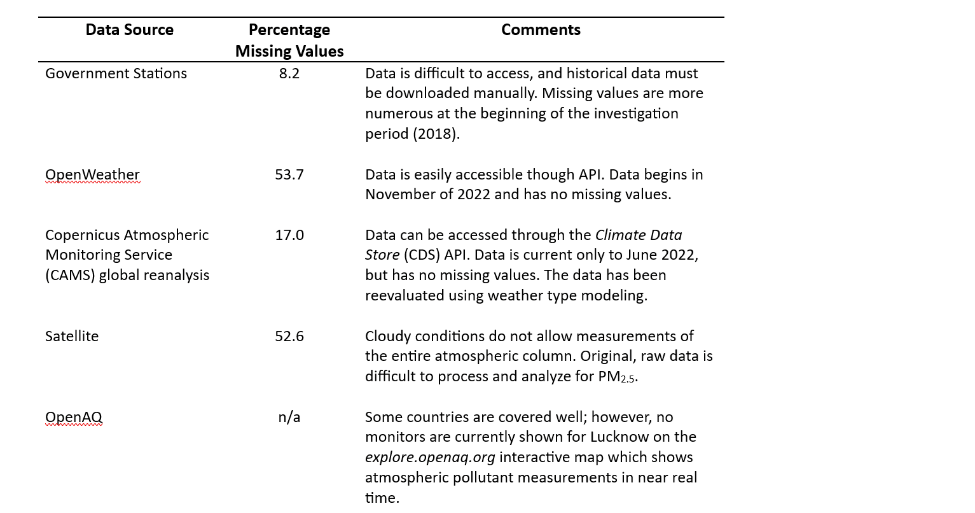
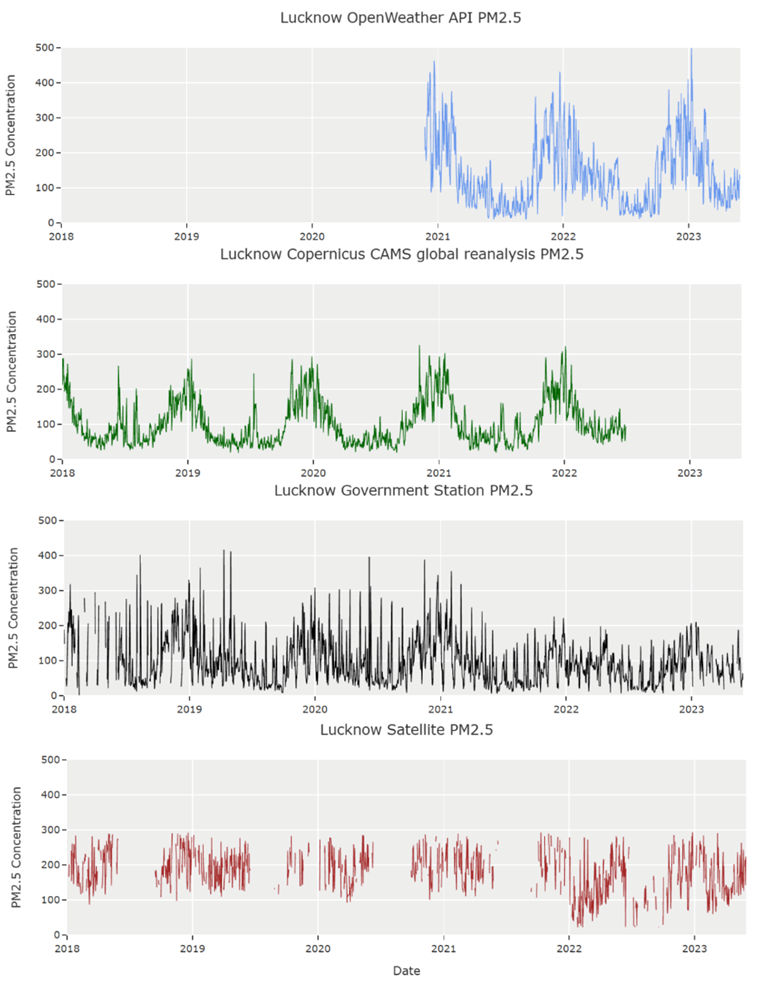
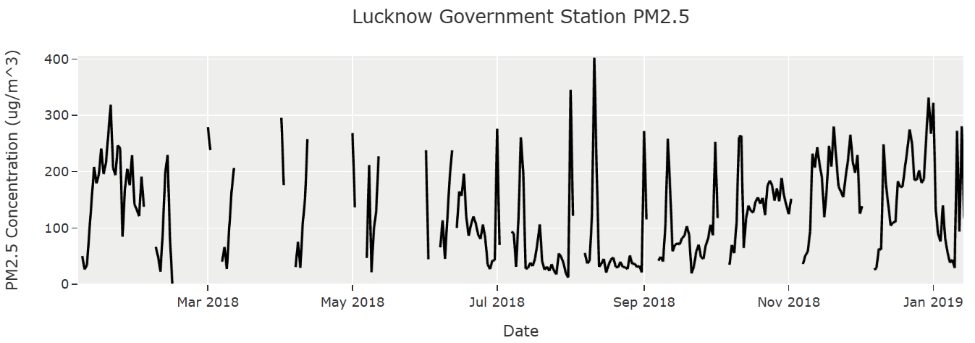
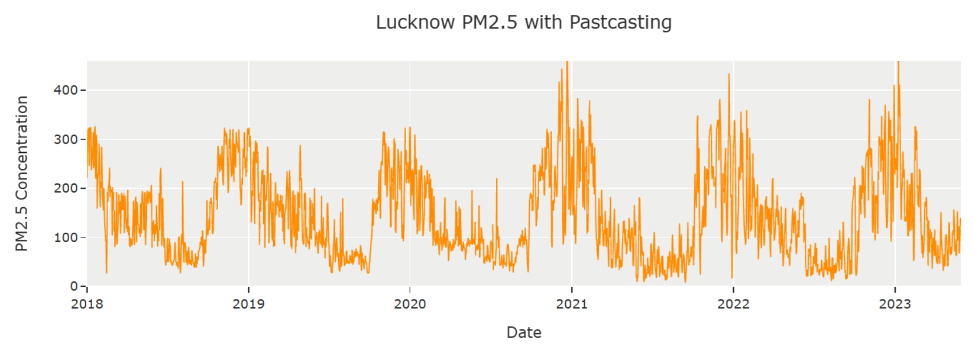
Satellite data can have over 50% missing values, and on-ground monitoring stations can have substantial sparsity both in their number and data (Figure 2). An air quality API does exist (Figure 1: blue time series), giving access to high quality, worldwide data; however, it is only available beginning in November 2020. The Satellite data has many missing values (Figure 1: brown time series). The Copernicus data (Figure 1: green time series) uses a reanalysis to fill in missing values [1], but it is missing the last year of data.
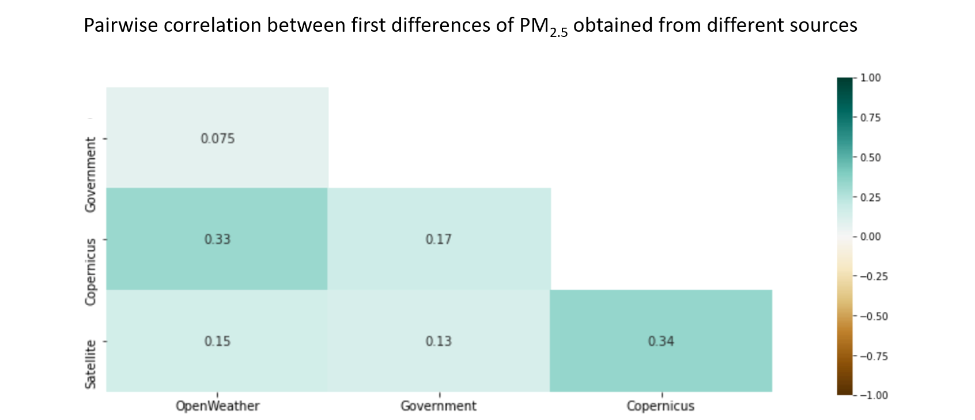
The correlation of first differences of PM2.5 data from the different sources (figure 4) is generally low. The strongest relationship is between The Copernicus reanalysis data and both OpenWeather [2] and the raw satellite data.
The Goal
Three questions proceed from this problem:
- For India, is it possible to create new API-quality data for the two to three years before November 2020—to pastcast a high-quality data set using machine learning methods?
- Can missing government, air quality monitoring data and satellite data be accurately filled in or imputed?
- Can this imputed data be used to pastcast or backfill an API-quality data set?
Just as many machine learning methods derive their performance from averaging over an ensemble or collection of decision trees, we produce an ensemble of machine learning approaches. To fill in missing values, we explore many methods ranging from K-nearest neighbor (data points close together in feature space will have similar values) to MissForest[3]. With all these investigations, integrating information from multiple time series to fill missing values emerges as a common theme.
In this blog, we highlight some methods to fill in the missing data. We use matrix completion to fill in the missing satellite and monitoring data allowing us to create a model that can pastcast an API-quality data set, giving researchers the longer-term data they need.
Missing Air Quality Data Patterns
The most reliable data for atmospheric pollutants, NO2 (nitrogen dioxide), SO2 (sulfur dioxide), PM2.5 (particulate matter with a width less than 2.5 microns), and CO (carbon monoxide), is found through the pollution API of Openweathermap.org beginning in late 2020. NO2 and SO2 data, derived from satellite measurements, and government station data of NO2, SO2, CO, and PM2.5 both exist going back to 2018 for 54 cities in India. The atmospheric pollutants, NO2, SO2, CO, and PM2.5, have WHO guidelines [4] for exposure levels, indicating their risk to health. We focus on these pollutants, which are directly emitted, for this investigation. Tropospheric ozone, which is not directly emitted, could be modeled additionally with this pastcasting method. The time series of all NO2 and SO2 measurements of pollutants are shown in figure 5 for satellite and station data respectively. These top four plots highlight the missing values as areas of white and illustrate a substantial lack of data. Additionally, the overall trends with missing value frequency are shown with the vertical time series to the right of the plots. There is a decreasing trend in satellite measurements with time, and a roughly linear increase in monitoring station measurements with time, possibly as more monitoring stations are put into service.
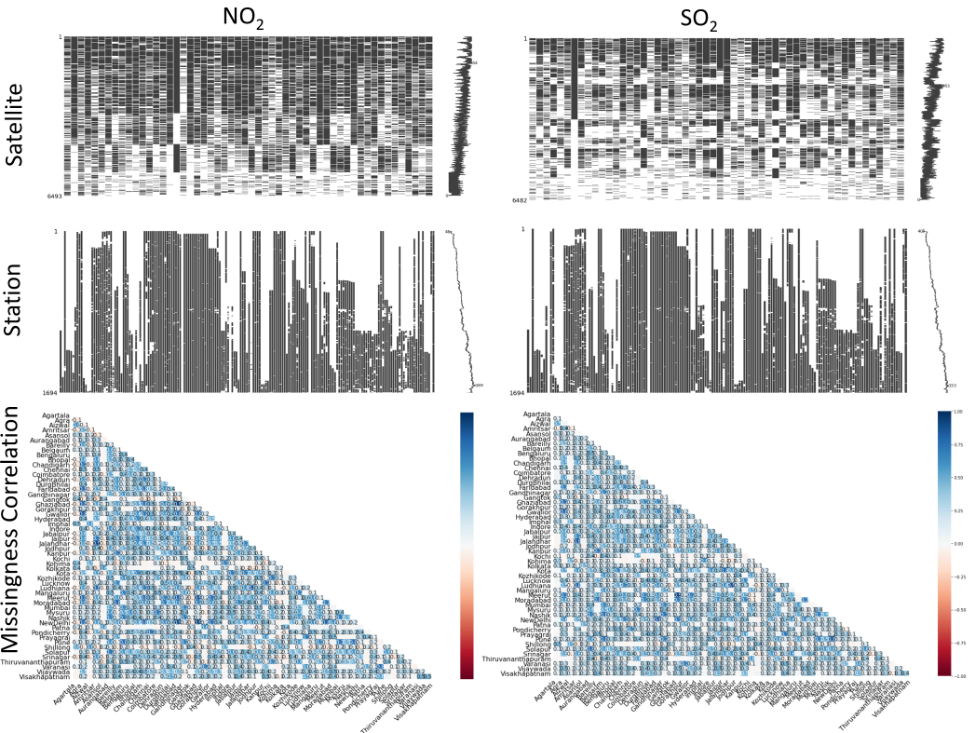
The bottom two plots display the correlation of missing values between all the cities. The blue indicates a positive correlation—often cities are missing data for the same days. In fact, other correlations exist that can be leveraged to fill in (impute) missing air pollution data.
Missing Data Imputation with Matrix Completion
The satellite measurement data for NO2 and SO2 has many missing values, usually caused by cloudy conditions above the city. Since the daily time series for satellite-derived NO2 and SO2 measurements should be correlated to the measurements of NO2, SO2, PM2.5, and CO obtained at the monitoring stations (these also had missing values for various reasons), a matrix made with these time series should have a fairly low rank. This low rank corresponds to many correlated measurements. Matrix completion [5], one of the methods that helped win the million-dollar Netflix prize [6] for filling in missing user movie ratings, works with the assumption that a data matrix is low rank. In fact, for missing air quality data, one study [7] found matrix completion to outperform imputing the missing values with the average values. Matrix completion is like alternating ridge regressions on the columns of the filled-in matrix [8]. Missing values are filled in and constantly improved by repeatedly regressing one column with another, seeking the simplest solution [9].
We make a matrix which includes all 263 daily time series of satellite or official government measurements of NO2, SO2, CO, or PM2.5 for all of India. Although matrix completion has been performed to fill missing data from a few, closely localized stations [7,10,11] , we hypothesize that applying matrix completion to all the measurements throughout the entire country could provide the most information available to fill in values simultaneously.
We perform matrix completion using the R [12] library softImpute [8]. By evaluating the performance on known, yet randomly removed matrix entries, we tune the hyperparameter, rank.max, and initially find it to have a value of 16. A maximum rank of 16 indicates that information from only 16 specific time series of measurements could be used to create the rest of the time series. If the time series comprising this matrix were independent (not correlated), the rank would be 263; however, constraining the rank to 16 during matrix completion indicates that the matrix is indeed low rank, and this algorithm is a good candidate for missing value replacement. The following code illustrates some of this approach:
# https://cran.r-project.org/web/packages/softImpute/vignettes/softImpute.html
library(softImpute)
.
.
.
# softImpute for imputation of missing values by matrix completion
# using the optimal hyperparameters
fits_t <- softImpute(A_t, rank.max=16, lambda=14.9, trace=TRUE, type="svd")
fits_v <- softImpute(A_v, rank.max=16, lambda=14.9, trace=TRUE, type="svd")
fits_g <- softImpute(A_g, rank.max=16, lambda=14.9, trace=TRUE, type="svd")

# create the complete matrix
fits_tc <- complete(A_t, fits_t)
fits_vc <- complete(A_v, fits_v)
fits_gc <- complete(A_g, fits_g)
Recreating the Past—Pastcasting API-Quality Data
Figure 5 summarizes the pastcasting (backfilling) procedure. Ideally, API-quality data would be available from January 2018 to August 2022. Unfortunately, API data is not available at the beginning of this time period; however, we establish a functional relationship between the API data and the satellite and monitoring station data for the time between November 2020 and December 2021. We use this relationship (model) to predict API-quality data for the earlier period using the satellite and station data that we have for that time period.
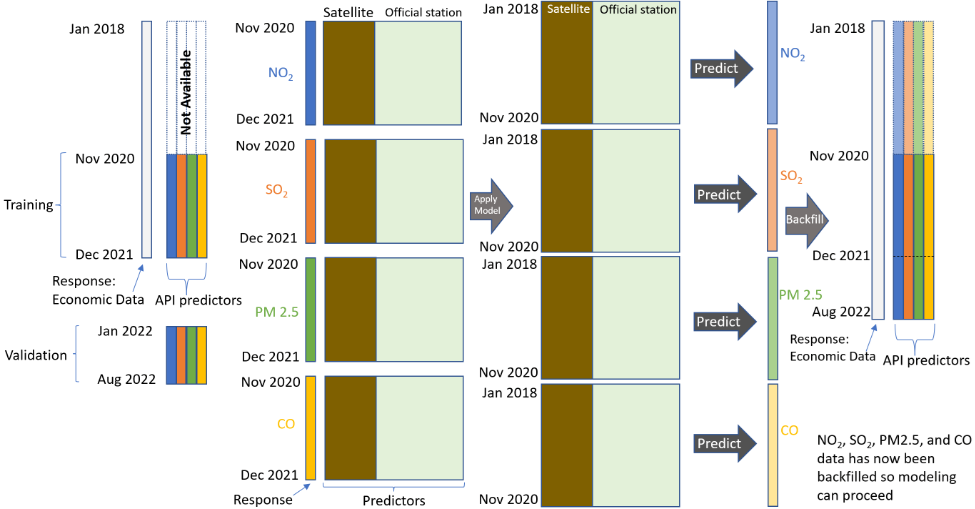
Although the figure for simplicity implies that we only created one model for NO2, SO2, CO, and PM2.5, all 54 cities of India have a separate model to predict the Openweathermap data that is not available. For example, to predict the NO2 concentration for the city of Lucknow, the model uses as training data any time series associated with this city, Lucknow. We use all possible atmospheric pollutant data for a city to create a model. Once the model is produced, we use it to pastcast (backfill) the missing NO2, SO2, CO, and PM2.5 values for each of the 54 cities.
We implement Random Forest models for all 54 cities and for predicting NO2, SO2, PM2.5, and CO using satellite NO2, satellite SO2, and measurements of NO2, SO2, PM2.5 and CO from government stations (when available for that city). Random Forest, which averages over many random decision trees, has been found to provide good predictive ability for time series data [13]. We use Scikit-learn’s [14] RandomForestRegressor package to train the models for each city. We tune hyperparameter values (the maximum depth and the minimum number of leaf samples) to produce the simplest models with the least predictive error. We choose the hyperparameter combinations with the lowest estimated prediction error. The following code illustrates some of this modeling:
import pandas as pd
import numpy as np
from sklearn.ensemble import RandomForestRegressor
.
.
.
# load the csv's from R after missing data imputation by matrix completion
dft = pd.read_csv('training_no_na.csv')
dfv = pd.read_csv('validation_no_na.csv')
dfg = pd.read_csv('generate_api_data_no_na.csv')
.
.
.
# use optimal hyperparameters for model
rf = RandomForestRegressor(max_depth=10, random_state=37, max_features='sqrt',
                           min_samples_leaf=5, oob_score=True).fit(X_train, y_train)
Conclusion: Backfilled Lucknow Time Series
Figure 7 shows NO2, SO2, and PM2.5 concentrations from January 2018 to May 2023 for the city of Lucknow. The backfilled data spans the period from January 2018 to approximately December 2020. The backfilled data captures the expected seasonality; however, it seems to be less noisy, not showing the large deviations that the Openweathermap data sometimes indicates.
Applications
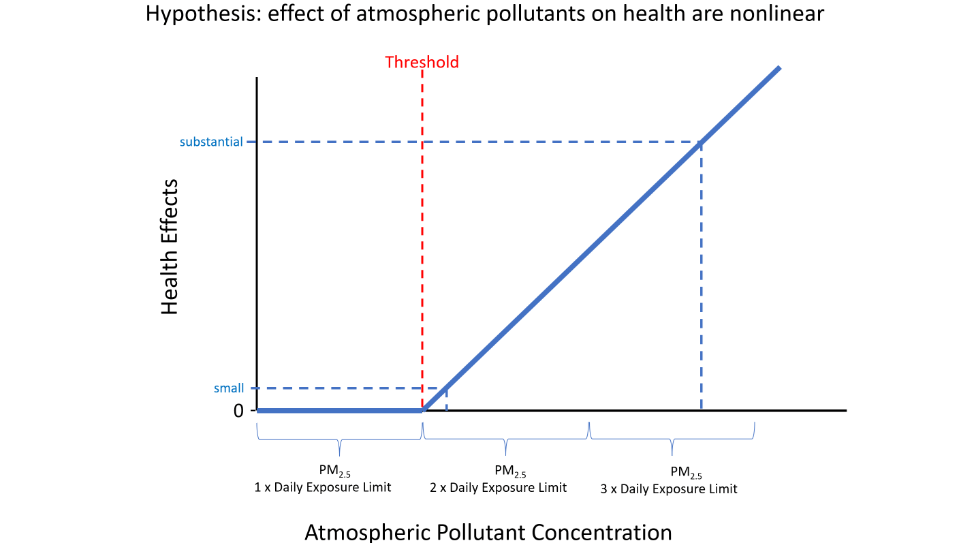
The medical journal, The Lancet, establishes commissions to give recommendations for health policy and practice. The Lancet Commission on Pollution and Health [15] details the link of PM2.5 to a wide range of diseases. Most of the studies establishing the relationship between PM2.5 and adverse health use annual averages. In a recent paper in the journal Nature [16], the authors showed how small air pollution particles (PM2.5) cause inflammation that promotes normally dormant lung cells with natural mutations to form actively growing tumors. Since inflammation is often a nonlinear response [17–19], investigating large daily deviations of PM2.5 that breach some threshold could provide new insights. Figure 7 shows just one of the possibilities that could be investigated. Additionally, asthma is caused by inflammation [20]. Could nonlinear effects of PM2.5 lead to an increase of emergency room visits or hospitalizations for asthma? Pastcasting—providing clean, complete data— can help answer such questions. At MacroX, we will explore these methods, making life easier for researchers.
Conclusion
With this pastcasting procedure, data important to researchers can be extended, giving 100% complete data for a research problem. In the future, we plan to tackle more aspects of obtaining clean data for air quality. Indeed, we will continue this open-source effort, using machine learning with alternative data to provide pastcasting tools for researchers to extend both their data and their impact.
References
[1] A. Inness, M. Ades, A. Agustı́-Panareda, J. Barré, A. Benedictow, A.-M. Blechschmidt, J.J. Dominguez, R. Engelen, H. Eskes, J. Flemming, others, The CAMS reanalysis of atmospheric composition, Atmospheric Chemistry and Physics. 19 (2019) 3515–3556.
[2] OpenWeather, (2022).
[3] D.J. Stekhoven, P. Bühlmann, MissForest—non-parametric missing value imputation for mixed-type data, Bioinformatics. 28 (2012) 112–118.
[4] W.H. Organization, others, WHO global air quality guidelines: Particulate matter (PM2. 5 and PM10), ozone, nitrogen dioxide, sulfur dioxide and carbon monoxide: Executive summary, (2021).
[5] E. Candès, B. Recht, Exact matrix completion via convex optimization, Communications of the ACM. 55 (2012) 111–119. https://doi.org/10.1145/2184319.2184343.
[6] Y. Koren, R. Bell, C. Volinsky, Matrix factorization techniques for recommender systems, Computer. 42 (2009) 30–37. https://doi.org/10.1109/mc.2009.263.
[7] Y. Yu, J. James, V.O. Li, J.C. Lam, Low-rank singular value thresholding for recovering missing air quality data, in: 2017 IEEE International Conference on Big Data (Big Data), IEEE, 2017: pp. 508–513.
[8] T. Hastie, R. Mazumder, J.D. Lee, R. Zadeh, Matrix completion and low-rank SVD via fast alternating least squares, The Journal of Machine Learning Research. 16 (2015) 3367–3402.
[9] T. Hastie, R. Tibshirani, J.H. Friedman, J.H. Friedman, The elements of statistical learning: Data mining, inference, and prediction, Springer, 2009.
[10] X. Chen, Y. Xiao, A novel method for air quality data imputation by nuclear norm minimization, Journal of Sensors. 2018 (2018).
[11] Y. Yu, J. James, V.O. Li, J.C. Lam, A novel interpolation-SVT approach for recovering missing low-rank air quality data, IEEE Access. 8 (2020) 74291–74305.
[12] RStudio Team, RStudio: Integrated development environment for r, RStudio, PBC, Boston, MA, 2022. http://www.rstudio.com/.
[13] M.J. Kane, N. Price, M. Scotch, P. Rabinowitz, Comparison of ARIMA and random forest time series models for prediction of avian influenza H5N1 outbreaks, BMC Bioinformatics. 15 (2014) 1–9.
[14] F. Pedregosa, G. Varoquaux, A. Gramfort, V. Michel, B. Thirion, O. Grisel, M. Blondel, P. Prettenhofer, R. Weiss, V. Dubourg, J. Vanderplas, A. Passos, D. Cournapeau, M. Brucher, M. Perrot, E. Duchesnay, Scikit-learn: Machine learning in Python, Journal of Machine Learning Research. 12 (2011) 2825–2830.
[15] P.J. Landrigan, R. Fuller, N.J. Acosta, O. Adeyi, R. Arnold, A.B. Baldé, R. Bertollini, S. Bose-O’Reilly, J.I. Boufford, P.N. Breysse, others, The lancet commission on pollution and health, The Lancet. 391 (2018) 462–512.
[16] W. Hill, E.L. Lim, C.E. Weeden, C. Lee, M. Augustine, K. Chen, F.-C. Kuan, F. Marongiu, E.J. Evans Jr, D.A. Moore, others, Lung adenocarcinoma promotion by air pollutants, Nature. 616 (2023) 159–167.
[17] K.T. Bogen, Inflammation as a cancer co-initiator: New mechanistic model predicts low/negligible risk at noninflammatory carcinogen doses, Dose-Response. 17 (2019) 1559325819847834.
[18] L.A. Cox Jr, Nonlinear dose-time-response functions and health-protective exposure limits for inflammation-mediated diseases, Environmental Research. 182 (2020) 109026.
[19] L. Yang, J. Yang, M. Liu, X. Sun, T. Li, Y. Guo, K. Hu, M.L. Bell, Q. Cheng, H. Kan, others, Nonlinear effect of air pollution on adult pneumonia hospital visits in the coastal city of qingdao, china: A time-series analysis, Environmental Research. 209 (2022) 112754.
[20] J.R. Murdoch, C.M. Lloyd, Chronic inflammation and asthma, Mutation Research/Fundamental and Molecular Mechanisms of Mutagenesis. 690 (2010) 24–39.