Key Takeaways:
- High interest rates, slow Chinese growth, and geopolitics have contributed to tepid growth in Brazil, Russia, India, Mexico (BRIM)
- But with China accelerating in Q3 there is positive momentum in Brazil, India, and Mexico. In contrast to the bullish official data, we still see Russia stagnating.
- In a deeper dive, we find Chinese growth rate and momentum relates statistically and economically significantly to many countries with trading relationships to China
| Country | MacroX Real-Time Growth (Z-Scored) | MacroX Real-Time Growth Momentum | PMI (Z-Scored) | Lagged Official Growth – Q2 GDP (annualized) | Inflation | CB Stance | Major Themes |
|---|---|---|---|---|---|---|---|
| Mexico | 0.23 | 0.39 | 0.77 | 3.2% | Inflation has slowed for 8 consecutive months but still above target (5.8% v 3%) | Neutral – rates on hold at 11.25% | Growth robust |
| India | -0.03 | 0.28 | 1.32 | 7.8% | Inflation around 5-6% | Neutral – BoI will not cut rates until inflation closer to 4% | Growth robust but vulnerable to oil prices |
| Brazil | -0.30 | 0.19 | 0.06 | 3.6% | Core inflation steadily declining but still well above target (6% v 3.25%) | Dovish – central bank has started rate cutting cycle | Growth robust |
| China | -0.31 | 0.48 | 0.07 | 3.2% | Both headline and core inflation <1% | Mostly Dovish – PBoC has cut rates repeatedly over last 6 months | Economy performance has disappointed since reopening – real estate sector is in crisis |
| Russia | -0.33 | -0.50 | 0.68 | 4.9% | Accelerating – headline inflation at 6% | Hawkish – CBoR raised rates to 13% last month due to inflation and currenct concerns | RBoR has had to drastically raise rates to combat inflation and defend currency |
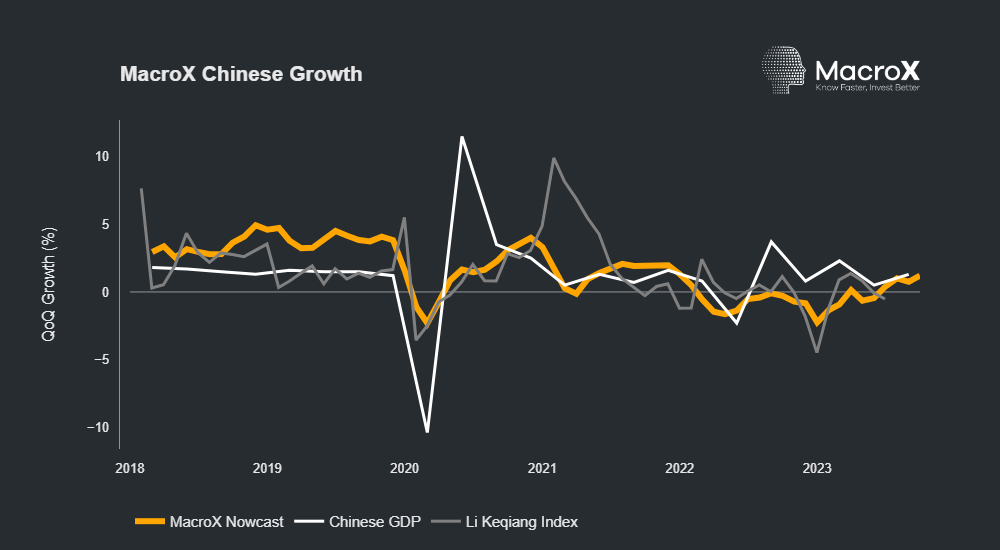
China: Picking Up
Much ink has been spilt on China’s disappointing economic performance this year (indeed we’ve spoken in-depth about it here and here). Just this week, Country Garden’s admission that it was unable to repay a loan has made it the latest casualty of the crisis in the Chinese real estate market. Given this, the acceleration in Q3 growth reported by the authorities might be hard to believe. However, our nowcast of Chinese activity has some encouraging news, we also saw the acceleration in activity! As our real-time growth momentum shows, there was a real acceleration in activity in Q3 2023 compared to Q2 which we picked up in our August post on the Chinese economy. Growth remains below trend but it seems as if the multiple stimulus measures enacted by the Chinese authorities seem to be supporting activity, as the below chart shows:
In more reassuring news, having flirted with deflation earlier this year, Chinese inflation data has been encouragingly positive with the last three MoM prints being well above zero. Therefore despite annual inflation measures still looking perilously low, looking at monthly or quarterly inflation rates annualized shows a much more promising picture and authorities will be hoping this recent momentum continues.
High Interest Rates Bite BRIM
Our nowcasts of economic activity show economic activity below trend across much of BRICM in Q3 with Mexico a noticeable exception. However our momentum tracker shows the Brazilian, Indian and Mexican economies all accelerated in Q3 – indeed optimism over the Indian economy seems widespread with the IMF recently upgrading their 2023 and 2024 growth forecasts.
This below trend growth across much of BRIM can be attributed to the scale of monetary tightening that has take place as shown by the chart below:
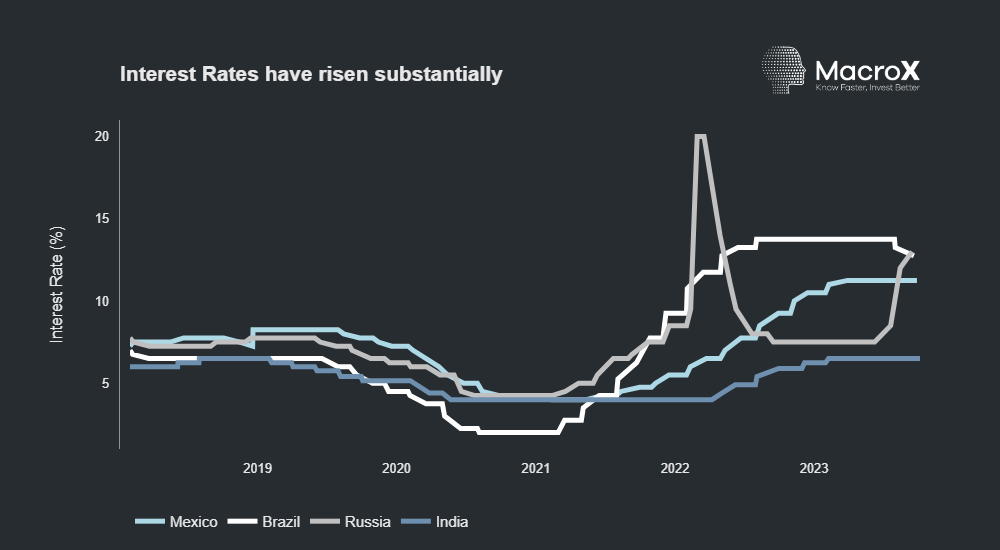
Given our nowcast of the Russian economy already show activity below trend, the impact of the dramatic tightening that the Central Bank of Russia has been forced to undertake over the last three months to combat inflation and defend the currency may cause economic activity to drop even further.
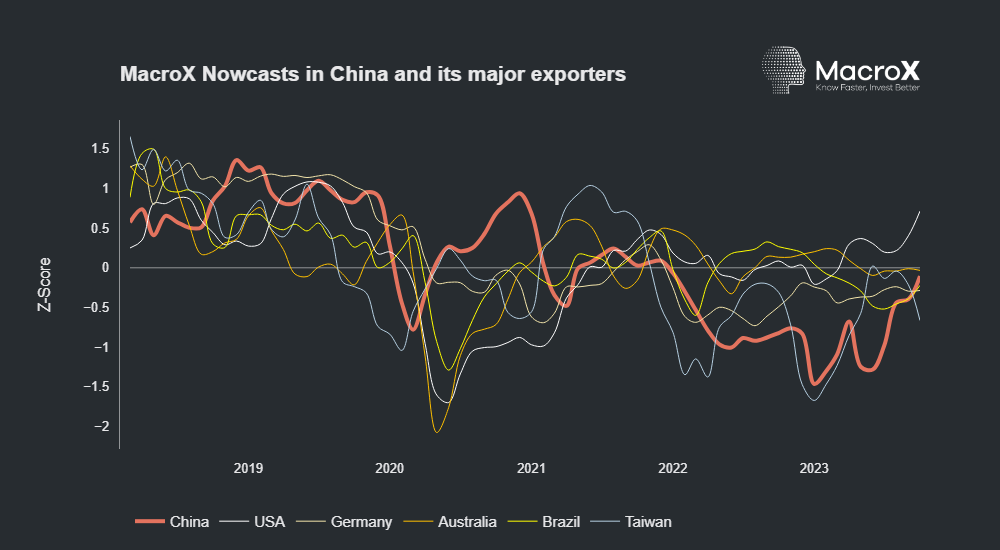
Will Chinese activity drive the rest of the world up too?
What are the implications for the acceleration in Chinese growth in Q3? We thought it would be interesting to see if our monthly nowcasts could shed light on the relationship between Chinese growth and growth in the countries that export to China. Taiwan, USA, Australia, Russia, Germany and Brazil all rank within the top 10 exporters to China by volume and, luckily we nowcast economic activity in all of them! Intuitively we’d expect growth in China to be positively correlated with growth in the countries that export to it but how strong is that relationship? Our nowcasts are available monthly from the start of 2018 and we first looked graphically over this time period at a time series of our nowcasts in all of these countries as shown below:
We also ran two regressions to quantify the relationship:
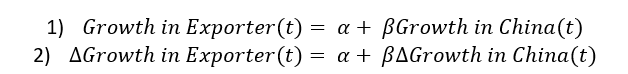
We realized that using the entire time-period included the covid downturn across economies which could be thought of as a coordinated global economic shock (indeed this can be easily seen in the time series chart). Therefore we’d expect to see our growth nowcasts exhibit similar behavior which might artificially boost the statistical relationship between growth across countries. Looking at the time series, the covid period does seem to be a structural break in the data justifying its exclusion. Given this, we ran the regressions taking 2020 out of the data set which produced the following results (including 2020 produced similar but weaker results):
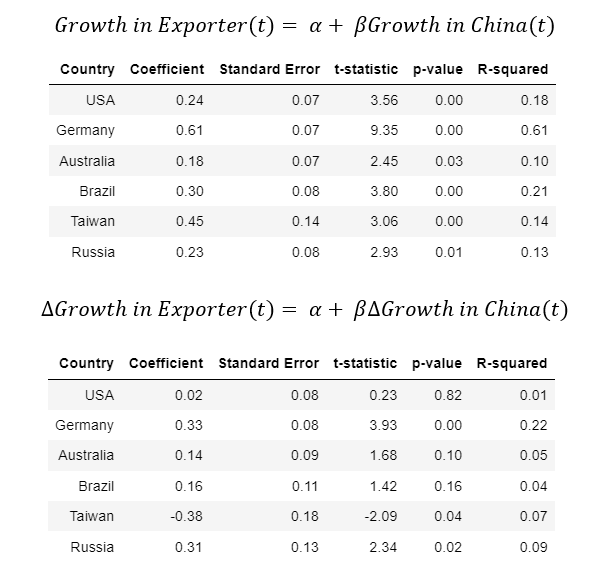
As can be seen by the table, there is a strong positive statistical relationship between our nowcast of Chinese economic activity and our nowcasts of all of China’s major trading partners. When looking at first differences the strength of the relationships fall significantly (unsurprisingly given the inherent noisiness of monthly differenced data) but there is still a strong positive statistical relationship between the momentum in our Chinese nowcast and the momentum in our German and Russian nowcasts.
The results of these regressions support the importance of the Chinese economy to global growth and show how the acceleration of the Chinese economy could have dramatic consequences for its major trading partners.
How our Nowcasting Engine works
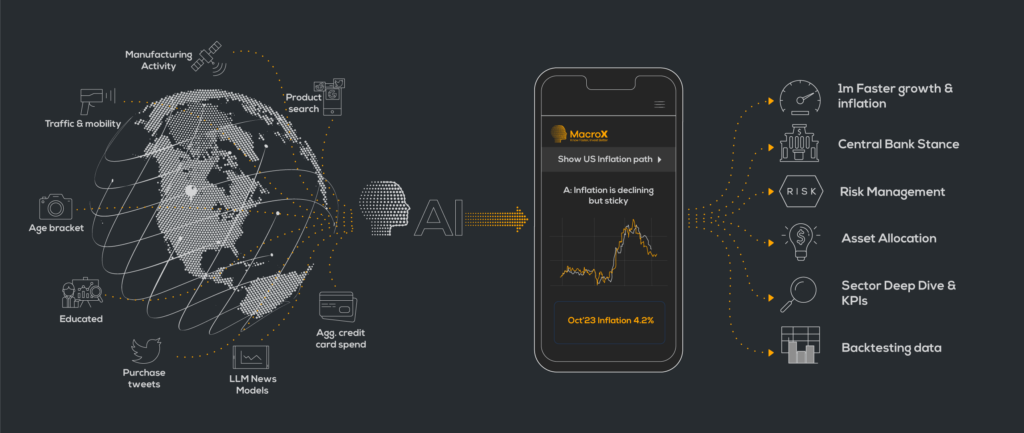
At MacroX, we use 100+ alternative data signals (from news, satellite, sensor, and social media) coupled with the latest in ML/AI techniques to generate our nowcasts of economic activity. Each component of our nowcast corresponds to economic activity in different ways; our news and social nowcasts (which use the latest LLM technology) can be thought of as a measure of sentiment, our satellite nowcast tracks industrial activity and our sensor nowcast quantify mobility trends. By using a combination of alternative data sources, we create a comprehensive picture of the economy that is real-time and accurate.
If you’re an institutional investor and would like access to our Nowcasting platform, sign up here to join our Waitlist.